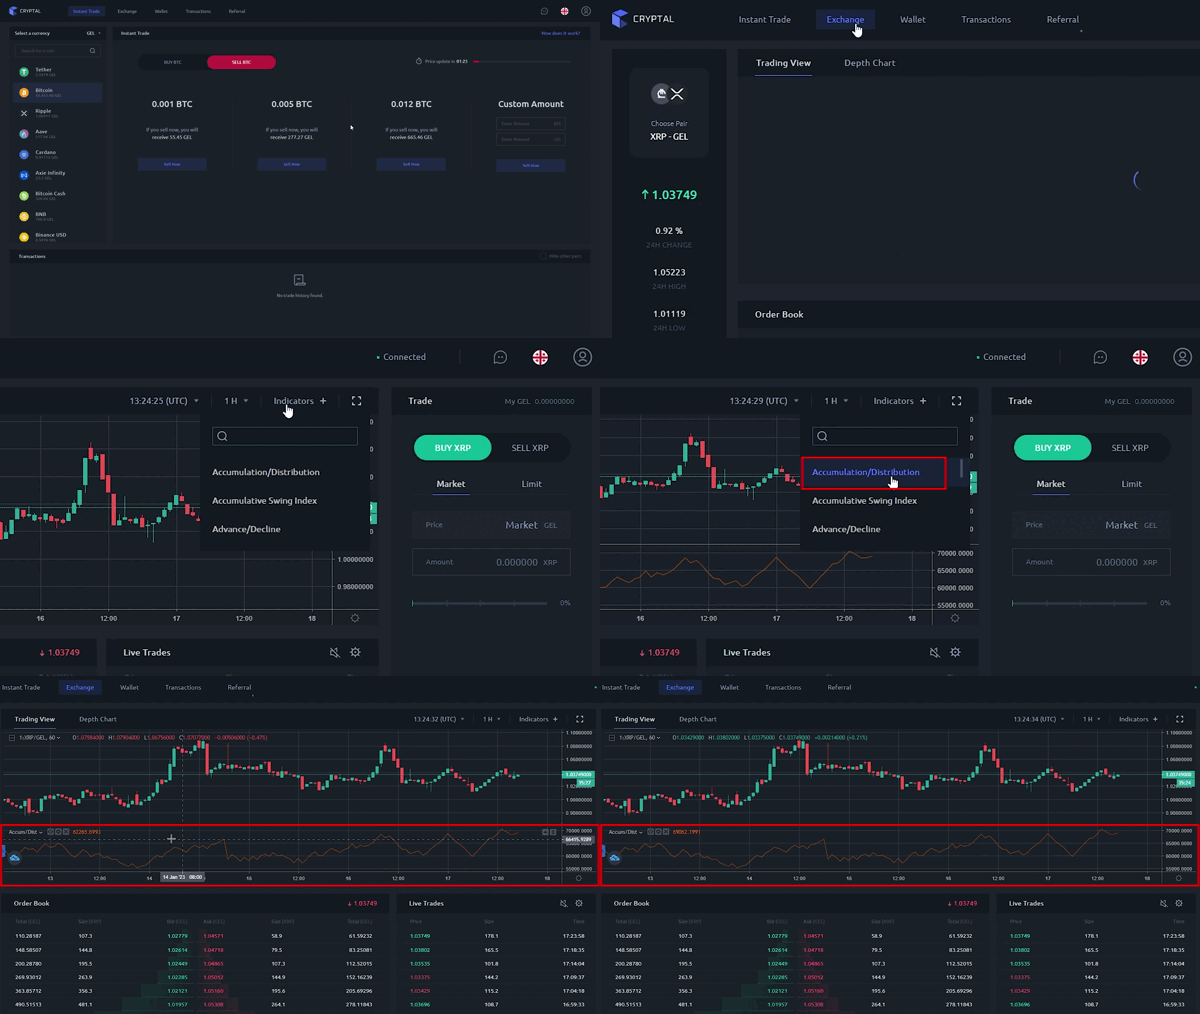
Basic economics tell us that supply and demand (i.e., volume) influence price. By watching the trading volume of an asset, the price movements can be indicative of useful trends for planning your next trades. This is what the Accumulation/Distribution (A/D) indicator aims to do.

The A/D indicator looks for divergences between prices and trading volume. The strength of a trend can then be measured by these signals. When the price increases but the volume lags, this suggests that the market demand is not sufficient to support a continuing uptrend and a correction or reversal is likely.
The A/D indicator continually takes in data and correlates two or more periods to come up with an measurement of accumulation (buying) against distribution (volume). However, it does not look at price changes from one period to the next, only at where the price closes within the current period’s range.. In cases of heavy trading, an asset may drop in price but still close near its upper range. The A/D indicator would rise, although the price is actually down. This is why traders must also monitor price and take note of contradictory signals.
This indicator is only one facet of a much bigger picture when looking at trends. To get a more complete assessment of the strength or weakness of a market trend, other analytics need to be considered, such as chart patterns and moving averages.
